For proper planning & formulation of any programme in the livestock sector, its effective implementation & monitoring, data is required at every possible administrative and geographic level. The Livestock Census is the main source of such data in the country. The first Livestock Census in India was carried out in 1919-1920. Since then it has been conducted once in every five years.
Livestock Census is conducted by Ministry of Agriculture, Department of Animal Husbandry, Dairying & Fisheries, Government of India, New Delhi with the help of A.H. & Veterinary Department, Government of Assam in our state.
Enumerators/Supervisors are recruited from Officers & staffs of the A.H. & Veterinary Department, Government of Assam. If required, outsourcing also be done for the purpose. During the Census, the Enumerators/Supervisors develop a cordial relation with the inhabitants of the village/ward by meeting the concerned officials/persons in the village/ward like Gram Pradhan, Panchayat Members, Government Officials, Religious/Community Leaders, etc. and take them in confidence. This helps in removing the misapprehensions of the people and ease out hostility, if any, in the work of enumeration.
During the enumeration, various species of animals (Cattle, Buffaloes, Sheep, Goat, Pig, Horse, Dog, Elephant, etc.) and birds (Fowl, Duck, other poultry birds, etc.) possessed by households, enterprises and institutions are counted at site. Data is generally presented separately for rural & urban areas. The data collected in the Census is utilised for planning and formulation of various schemes/programmes of Animal Husbandry & Veterinary Sector, and is also used for statistical purposes.
Key Results of the 20th Livestock Census of Assam
(Compiled By: Dr. Dibjyoti Hanse, Coordinator, National Livestock Mission, Assam)
Livestock Population (In Lacs) of Assam 2019, Share of Major Species
|
Category |
2019 |
Share |
|
Cattle |
109.09 |
60% |
|
Buffalo |
4.22 |
2% |
|
Sheep |
3.32 |
2% |
|
Goat |
43.15 |
24% |
|
Pig |
20.99 |
12% |
|
Others |
0.15 |
0.08% |
|
Total Livestock |
180.92 |
|
Livestock Population (In Lacs) of Assam from 2007 to 2019 – Major Species
|
Category |
2007 |
2012 |
2019 |
% Growth 2019 vs 2007 |
% Growth 2019 vs 2012 |
|
Cattle |
100.41 |
103.08 |
109.09 |
9% |
6% |
|
Buffalo |
5.00 |
4.35 |
4.22 |
-16% |
-3% |
|
Sheep |
3.54 |
5.11 |
3.32 |
-6% |
-35% |
|
Goat |
43.20 |
61.69 |
43.15 |
0% |
-30% |
|
Pig |
20.00 |
16.36 |
20.99 |
5% |
28% |
|
Total |
172.15 |
190.59 |
180.77 |
5% |
-5% |
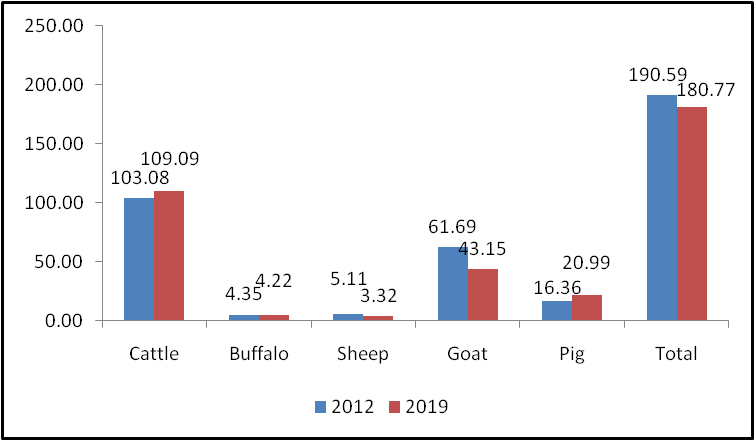
Livestock Population (In Lacs) of Assam from 2012 vs 2019 – Major Species
|
Category |
2012 |
2019 |
% Growth 2019 vs 2012 |
|
Cattle |
103.08 |
109.09 |
6% |
|
Buffalo |
4.35 |
4.22 |
-3% |
|
Sheep |
5.11 |
3.32 |
-35% |
|
Goat |
61.69 |
43.15 |
-30% |
|
Pig |
16.36 |
20.99 |
28% |
|
Total |
190.59 |
180.77 |
-5% |
Livestock Population in Major Districts of Assam
|
Sl. No. |
District |
Population (in Lacs) 2012 |
Population (in Lacs) 2019 |
% Change |
% Share of Total |
|
1 |
Lakhimpur |
9.64 |
10.39 |
8% |
5.7% |
|
2 |
Golaghat |
7.52 |
9.62 |
28% |
5.3% |
|
3 |
DHEMAJI |
7.31 |
8.94 |
22% |
4.9% |
|
4 |
Nagaon |
12.05 |
8.82 |
-27% |
4.9% |
|
5 |
Sonitpur |
16.50 |
8.52 |
-48% |
4.7% |
|
6 |
Kamrup |
10.75 |
7.96 |
-26% |
4.4% |
|
7 |
Barpeta |
7.16 |
7.44 |
4% |
4.1% |
|
8 |
Jorhat |
7.73 |
7.29 |
-6% |
4.0% |
|
9 |
Karbi Anglong |
8.23 |
7.27 |
-12% |
4.0% |
|
10 |
Darrang |
5.99 |
7.13 |
19% |
3.9% |
Top 10 Districts of Assam with Cattle Population
|
Sl. No. |
District |
Population (in Lacs) 2012 |
Population (in Lacs) 2019 |
% Change |
% Share of Total |
|
1 |
Lakhimpur |
6.08 |
6.29 |
4% |
5.8% |
|
2 |
Nagaon |
7.63 |
6.26 |
-18% |
5.7% |
|
3 |
Golaghat |
4.13 |
6.11 |
48% |
5.6% |
|
4 |
DHEMAJI |
4.53 |
5.27 |
16% |
4.8% |
|
5 |
Sonitpur |
9.42 |
5.14 |
-45% |
4.7% |
|
6 |
Kamrup |
5.41 |
5.00 |
-8% |
4.6% |
|
7 |
Barpeta |
3.84 |
4.83 |
26% |
4.4% |
|
8 |
Darrang |
3.43 |
4.57 |
33% |
4.2% |
|
9 |
Jorhat |
4.91 |
4.32 |
-12% |
4.0% |
|
10 |
Udalguri |
3.39 |
3.83 |
13% |
3.5% |
Top 10 Districts of Assam with Buffalo Population
|
Sl. No. |
District |
Population (in Lacs) 2012 |
Population (in Lacs) 2019 |
% Change |
% Share of Total |
|
1 |
Cachar |
0.56 |
0.50 |
-10% |
12.0% |
|
2 |
Darrang |
0.13 |
0.37 |
196% |
8.8% |
|
3 |
Dima Hasao |
0.24 |
0.34 |
40% |
8.1% |
|
4 |
Golaghat |
0.15 |
0.31 |
102% |
7.2% |
|
5 |
Karimganj |
0.40 |
0.28 |
-31% |
6.5% |
|
6 |
Jorhat |
0.26 |
0.21 |
-20% |
5.0% |
|
7 |
Barpeta |
0.27 |
0.21 |
-24% |
4.9% |
|
8 |
Hailakandi |
0.28 |
0.19 |
-31% |
4.6% |
|
9 |
Dhemaji |
0.15 |
0.17 |
14% |
3.9% |
|
10 |
Nagaon |
0.07 |
0.16 |
119% |
3.9% |
Top 10 Districts of Assam with Sheep Population
|
Sl. No. |
District |
Population (in Lacs) 2012 |
Population (in Lacs) 2019 |
% Change |
% Share of Total |
|
1 |
Barpeta |
0.98 |
0.52 |
-47% |
15.6% |
|
2 |
Darrang |
0.41 |
0.35 |
-15% |
10.6% |
|
3 |
Dhubri |
1.18 |
0.32 |
-73% |
9.7% |
|
4 |
Cachar |
0.17 |
0.27 |
55% |
8.2% |
|
5 |
Karimganj |
0.21 |
0.24 |
10% |
7.1% |
|
6 |
Goalpara |
0.29 |
0.23 |
-20% |
7.0% |
|
7 |
Nagaon |
0.12 |
0.19 |
56% |
5.6% |
|
8 |
Kamrup |
0.33 |
0.18 |
-47% |
5.3% |
|
9 |
Nalbari |
0.14 |
0.16 |
12% |
4.8% |
|
10 |
South Salmara |
New District |
0.15 |
0% |
4.5% |
Top 10 Districts of Assam with Goat Population
|
Sl. No. |
District |
Population (in Lacs) 2012 |
Population (in Lacs) 2019 |
% Change |
% Share of Total |
|
1 |
Karbi Anglong |
2.81 |
2.80 |
-1% |
6.5% |
|
2 |
Sonitpur |
5.02 |
2.51 |
-50% |
5.8% |
|
3 |
Dibrugarh |
2.96 |
2.02 |
-32% |
4.7% |
|
4 |
Lakhimpur |
2.10 |
2.02 |
-4% |
4.7% |
|
5 |
Golaghat |
2.37 |
1.98 |
-16% |
4.6% |
|
6 |
Kamrup |
4.24 |
1.92 |
-55% |
4.4% |
|
7 |
Baksa |
1.92 |
1.80 |
-6% |
4.2% |
|
8 |
Barpeta |
1.95 |
1.78 |
-9% |
4.1% |
|
9 |
Jorhat |
1.83 |
1.74 |
-5% |
4.0% |
|
10 |
Nagaon |
3.78 |
1.70 |
-55% |
3.9% |
Top 10 Districts of Assam with Pig Population
|
Sl. No. |
District |
Population (in Lacs) 2012 |
Population (in Lacs) 2019 |
% Change |
% Share of Total |
|
1 |
Dhemaji |
1.19 |
2.33 |
96% |
11.1% |
|
2 |
Lakhimpur |
1.31 |
1.96 |
49% |
9.3% |
|
3 |
Karbi Anglong |
1.62 |
1.88 |
16% |
9.0% |
|
4 |
Golaghat |
0.86 |
1.19 |
37% |
5.6% |
|
5 |
Dibrugarh |
1.17 |
1.12 |
-5% |
5.3% |
|
6 |
Kokrajhar |
0.88 |
1.05 |
19% |
5.0% |
|
7 |
Jorhat |
0.72 |
1.01 |
40% |
4.8% |
|
8 |
Udalguri |
0.69 |
0.99 |
44% |
4.7% |
|
9 |
Biswanath |
New District |
0.93 |
0% |
4.4% |
|
10 |
West Karbi Anglong |
New District |
0.83 |
0% |
4.0% |
Ranking of Districts as per Livestock Population (In Lacs) of Major Species
|
Sl.No. |
District Name |
Total Livestock |
Rank |
Cattle |
Rank |
Buffalo |
Rank |
Sheep |
Rank |
Goat |
Rank |
Pig |
Rank |
|
1 |
Lakhimpur |
10.3930 |
1 |
6.2903 |
1 |
0.1167 |
15 |
0.0066 |
23 |
2.0207 |
4 |
1.9588 |
2 |
|
2 |
Golaghat |
9.6178 |
2 |
6.1145 |
3 |
0.3055 |
4 |
0.0298 |
18 |
1.9830 |
5 |
1.1850 |
4 |
|
3 |
Dhemaji |
8.9353 |
3 |
5.2698 |
4 |
0.1665 |
9 |
0.0228 |
19 |
1.1509 |
20 |
2.3252 |
1 |
|
4 |
Nagaon |
8.8242 |
4 |
6.2645 |
2 |
0.1630 |
10 |
0.1866 |
7 |
1.6983 |
10 |
0.5118 |
17 |
|
5 |
Sonitpur |
8.5162 |
5 |
5.1398 |
5 |
0.0716 |
20 |
0.0299 |
17 |
2.5071 |
2 |
0.7677 |
13 |
|
6 |
Kamrup |
7.9565 |
6 |
4.9994 |
6 |
0.0708 |
21 |
0.1767 |
8 |
1.9174 |
6 |
0.7923 |
12 |
|
7 |
Barpeta |
7.4404 |
7 |
4.8252 |
7 |
0.2063 |
7 |
0.5191 |
1 |
1.7771 |
8 |
0.1128 |
27 |
|
8 |
Jorhat |
7.2897 |
8 |
4.3240 |
9 |
0.2110 |
6 |
0.0061 |
24 |
1.7380 |
9 |
1.0107 |
7 |
|
9 |
Karbi Anglong |
7.2724 |
9 |
2.5506 |
24 |
0.0388 |
26 |
0.0029 |
29 |
2.7963 |
1 |
1.8838 |
3 |
|
10 |
Darrang |
7.1313 |
10 |
4.5743 |
8 |
0.3707 |
2 |
0.3509 |
2 |
1.6188 |
12 |
0.2167 |
24 |
|
11 |
Dibrugarh |
6.6747 |
11 |
3.4062 |
17 |
0.1253 |
13 |
0.0042 |
27 |
2.0238 |
3 |
1.1152 |
5 |
|
12 |
Baksa |
6.3198 |
12 |
3.6411 |
12 |
0.0081 |
33 |
0.0521 |
16 |
1.7998 |
7 |
0.8187 |
11 |
|
13 |
Biswanath |
6.1958 |
13 |
3.6226 |
13 |
0.1311 |
12 |
0.0643 |
15 |
1.4519 |
15 |
0.9260 |
9 |
|
14 |
Udalguri |
6.1867 |
14 |
3.8313 |
10 |
0.0272 |
27 |
0.0208 |
20 |
1.3149 |
17 |
0.9925 |
8 |
|
15 |
Kokrajhar |
6.0645 |
15 |
3.3359 |
19 |
0.0783 |
19 |
0.1422 |
11 |
1.4553 |
14 |
1.0527 |
6 |
|
16 |
Tinsukia |
6.0380 |
16 |
3.8253 |
11 |
0.0975 |
16 |
0.0012 |
30 |
1.5401 |
13 |
0.5740 |
15 |
|
17 |
Cachar |
5.8961 |
17 |
3.5484 |
16 |
0.5045 |
1 |
0.2710 |
4 |
1.3939 |
16 |
0.1783 |
25 |
|
18 |
Dhubri |
5.3243 |
18 |
3.5606 |
14 |
0.1243 |
14 |
0.3229 |
3 |
1.2971 |
18 |
0.0194 |
32 |
|
19 |
Goalpara |
5.1792 |
19 |
3.3362 |
18 |
0.0853 |
18 |
0.2319 |
6 |
1.0298 |
23 |
0.4960 |
18 |
|
20 |
Morigaon |
4.8180 |
20 |
3.5548 |
15 |
0.0432 |
25 |
0.0844 |
14 |
0.8225 |
24 |
0.3132 |
22 |
|
21 |
Nalbari |
4.5665 |
21 |
2.5021 |
25 |
0.0581 |
23 |
0.1581 |
9 |
1.6929 |
11 |
0.1552 |
26 |
|
22 |
Sibsagar |
4.4916 |
22 |
2.6603 |
22 |
0.1483 |
11 |
0.0031 |
28 |
1.0398 |
22 |
0.6402 |
14 |
|
23 |
Karimganj |
4.1496 |
23 |
2.7917 |
21 |
0.2753 |
5 |
0.2354 |
5 |
0.8066 |
25 |
0.0405 |
30 |
|
24 |
Bongaigaon |
3.8843 |
24 |
2.5695 |
23 |
0.0124 |
29 |
0.1156 |
12 |
1.0746 |
21 |
0.1122 |
28 |
|
25 |
Hojai |
3.7959 |
25 |
2.9879 |
20 |
0.0122 |
30 |
0.0142 |
22 |
0.7081 |
26 |
0.0735 |
29 |
|
26 |
West Karbi Anglong |
3.4010 |
26 |
1.1960 |
31 |
0.0883 |
17 |
0.0005 |
32 |
1.2855 |
19 |
0.8307 |
10 |
|
27 |
Chirang |
3.2919 |
27 |
2.0767 |
26 |
0.0175 |
28 |
0.0147 |
21 |
0.6251 |
27 |
0.5580 |
16 |
|
28 |
South Salmara |
2.2375 |
28 |
1.4192 |
27 |
0.0455 |
24 |
0.1499 |
10 |
0.6185 |
28 |
0.0044 |
33 |
|
29 |
Hailakandi |
2.1636 |
29 |
1.3223 |
28 |
0.1922 |
8 |
0.0917 |
13 |
0.5318 |
29 |
0.0256 |
31 |
|
30 |
Kamrup (M) |
1.9472 |
30 |
1.2025 |
30 |
0.0095 |
31 |
0.0055 |
25 |
0.4461 |
31 |
0.2835 |
23 |
|
31 |
Majuli |
1.8476 |
31 |
1.2376 |
29 |
0.0625 |
22 |
0.0007 |
31 |
0.2034 |
33 |
0.3435 |
20 |
|
32 |
Soraideu |
1.6978 |
32 |
0.8861 |
32 |
0.0092 |
32 |
0.0001 |
33 |
0.4755 |
30 |
0.3269 |
21 |
|
33 |
Dima Hasao |
1.2240 |
33 |
0.2258 |
33 |
0.3407 |
3 |
0.0053 |
26 |
0.3070 |
32 |
0.3452 |
19 |
|
|
Total |
180.77 |
|
109.09 |
|
4.22 |
|
3.32 |
|
43.15 |
|
20.99 |
|
District wise Poultry Population (In Lacs) of Assam 2019
|
Sl.No. |
District Name |
Total Poultry |
Population Rank |
% Share of Total |
|
1 |
Barpeta |
30.98 |
1 |
6.6% |
|
2 |
Nagaon |
29.22 |
2 |
6.3% |
|
3 |
Golaghat |
26.00 |
3 |
5.6% |
|
4 |
Dibrugarh |
20.58 |
4 |
4.4% |
|
5 |
Jorhat |
20.35 |
5 |
4.4% |
|
6 |
Dhemaji |
20.24 |
6 |
4.3% |
|
7 |
Sonitpur |
19.96 |
7 |
4.3% |
|
8 |
Lakhimpur |
19.17 |
8 |
4.1% |
|
9 |
Goalpara |
18.85 |
9 |
4.0% |
|
10 |
Kamrup |
18.31 |
10 |
3.9% |
|
11 |
Tinsukia |
18.27 |
11 |
3.9% |
|
12 |
Udalguri |
15.38 |
12 |
3.3% |
|
13 |
Dhubri |
14.27 |
13 |
3.1% |
|
14 |
Darrang |
14.10 |
14 |
3.0% |
|
15 |
Karbi Anglong |
13.99 |
15 |
3.0% |
|
16 |
Morigaon |
13.68 |
16 |
2.9% |
|
17 |
Sibsagar |
12.94 |
17 |
2.8% |
|
18 |
Karimganj |
12.81 |
18 |
2.7% |
|
19 |
Cachar |
12.57 |
19 |
2.7% |
|
20 |
Baksa |
12.42 |
20 |
2.7% |
|
21 |
Bongaigaon |
12.03 |
21 |
2.6% |
|
22 |
Hojai |
11.54 |
22 |
2.5% |
|
23 |
Kokrajhar |
11.47 |
23 |
2.5% |
|
24 |
Nalbari |
10.98 |
24 |
2.4% |
|
25 |
Biswanath |
10.25 |
25 |
2.2% |
|
26 |
South Salmara |
10.22 |
26 |
2.2% |
|
27 |
Hailakandi |
7.74 |
27 |
1.7% |
|
28 |
Chirang |
7.34 |
28 |
1.6% |
|
29 |
West Karbi Anglong |
6.89 |
29 |
1.5% |
|
30 |
Soraideu |
6.45 |
30 |
1.4% |
|
31 |
Dima Hasao |
3.97 |
31 |
0.9% |
|
32 |
Kamrup (M) |
2.51 |
32 |
0.5% |
|
33 |
Majuli |
1.66 |
33 |
0.4% |
|
|
Total |
467.12 |
|
|